Raman Spectroscopy
Raman
Spectroscopy is a technique used to study the vibrational, rotational, and
other low-frequency modes in a molecule or crystal. It provides valuable
information about molecular structures, chemical compositions, and crystalline
phases. The principle of Raman Spectroscopy is based on the interaction between
incident light and a sample, resulting in the scattering of photons at
different wavelengths.
Principle
of Raman Spectroscopy:
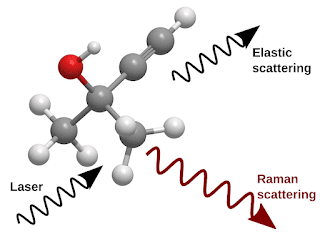
- Scattering
Process: When a monochromatic light source (usually
laser light) interacts with a sample, some photons are scattered
elastically (Rayleigh scattering), while others are scattered
inelastically. Raman scattering is an inelastic scattering process where
the energy of the scattered photon is shifted due to interactions with the
sample's vibrational modes.
- Raman
Shift: The energy difference between the incident and
scattered photons is called the Raman shift (Δν) and is directly
related to the vibrational energy levels of the sample.
- Spectrometer:
The scattered light is collected and analyzed using a spectrometer. The
resulting Raman spectrum provides information about the vibrational
frequencies and intensities of different molecular or crystal modes.
D
band and G band:
In
Raman Spectroscopy, the D band and G band are prominent features often observed
in the Raman spectrum of carbon materials, such as graphene and carbon
nanotubes.
- G
Band (Graphitic Band): The G band is a Raman peak that appears
at around 1,580 cm⁻¹ for pure graphene. It is associated with the E2g
phonon mode in the hexagonal lattice of carbon atoms and represents the
stretching motion of carbon-carbon (C-C) bonds in sp² hybridized carbon.
- D
Band (Disorder Band): The D band is another Raman peak that
typically appears at a lower frequency, around 1,350 cm⁻¹. It is related
to the presence of defects, disorder, or sp³ hybridized carbon atoms in
the carbon material. The D band arises from breathing modes of rings and is
often used as a measure of structural disorder.
Other
Features in Raman Spectroscopy:
In
addition to the D and G bands, Raman spectra can exhibit other peaks and
features, each corresponding to specific vibrational modes or interactions
within the sample:
- 2D
Band: This is a second-order Raman band observed in
graphene and related materials. It provides information about the number
of graphene layers and can be used to identify multilayer structures.
- Peak
Shifts: Raman spectra can show peak shifts due to changes
in the chemical composition, strain, or temperature of the sample. These
shifts can provide valuable information about the sample's properties.
- Combination
Bands: Raman spectra may contain combination bands,
which result from the interaction of multiple vibrational modes. These can
reveal information about complex molecular structures.
- Lattice
Vibrations: In crystalline materials, Raman
spectroscopy can provide insights into lattice vibrations, such as phonon
modes, which are specific to the crystal structure of the material.


0 Comments